
From 100 TH/s to 1 PH/s: The Timeline for 0.01 BTC
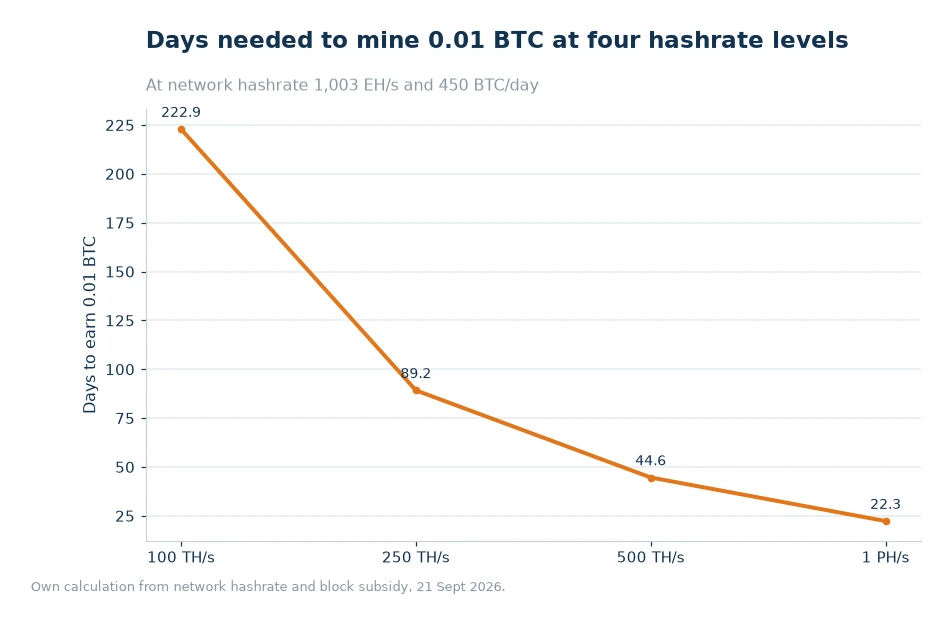
One hundredth of a bitcoin is a modest goal with an immodest timescale. At 100 TH/s it takes 222.9 days at a network hashrate of 1,003 EH/s; at 250 TH/s the wait drops to 89.2 days, at 500 TH/s to 44.6, and at 1 PH/s to 22.3. Nothing about the hardware changes between those rows except the number of terahashes. The rest of this article is about the inputs that do change, and how to watch them.

Key takeaways
- At 100 TH/s, 0.01 BTC needs 222.9 days; at 1 PH/s the same target needs 22.3 days.
- Daily output at 100 TH/s is 0.00004487 BTC, which is $3.80 gross at $84,692 per BTC.
- Pool hashrate sets how often blocks arrive, while Pool Luck measures the gap between expected and actual blocks.
- A 2.12% drop in difficulty, if it lands, shortens these timelines by roughly 2.2% at every hashrate.
What one hundredth of a bitcoin represents
At $84,692 per BTC, 0.01 BTC is $846.92. That is the gross value of the target, before power, hardware and any listed fee, and it is a useful sanity check on the whole exercise. A single 100 TH/s machine earning $3.80 a day gross needs 222.9 days to produce that much value, which is roughly seven and a half months of continuous operation. If the machine draws three kilowatts and power costs six cents a kilowatt-hour, the electricity bill over the same period is around $790 at 3 kW and $0.06/kWh arithmetic — close enough to the gross output that the margin, not the target, becomes the real subject.
That comparison is why target-based planning is worth doing before a purchase rather than after. The timeline is not a promise of profit; it is a statement about how long a machine must run to emit a fixed quantity of coins. Power, cooling and uptime decide whether the run is worth starting.
Difficulty is the denominator nobody controls
The formula divides your hashrate by the network's, and the network's hashrate follows difficulty. When more machines join, difficulty adjusts upward and every existing terahash produces less. When machines leave, difficulty falls and the remaining ones produce more. The change is bounded per adjustment, roughly a couple of percent in quiet periods and considerably more in volatile ones, but it never stops.
On the read date, the next estimate was −2.12%. Applied to a 222.9-day timeline, that is about 218 days, and applied to 22.3 days it is about 21.8. Small in absolute terms, meaningful in direction: the timeline is a moving estimate, and a plan built on a single snapshot will be slightly wrong within a fortnight. Recomputing is cheap; assuming is not. A model that keeps difficulty as a visible cell is easier to trust than one that hides it inside a hard-coded daily rate.
Reading the pool's own numbers
The ViaBTC BTC Mining Pool state page publishes the figures that make this concrete: the pool's own hashrate, its share of the network, and a luck reading for recent blocks. Pool Hashrate tells you how much of the network the pool controls, which sets how frequently it finds blocks. A pool with a larger share finds blocks more often, so PPLNS settlements arrive in smaller, more regular pieces.
Pool Luck compares blocks found with blocks expected. A reading above 100% means the pool found more than its share implied; below 100% means fewer. It is a description of a window, not a score. Over a year the reading tends toward 100% by construction, and a poor week is usually followed by an ordinary one. What matters for a miner is which payment method is in force, because PPS+ settles hourly against difficulty and is untouched by a lucky or unlucky run, while PPLNS lives with the run directly.
The four timelines in one table
Each row uses the same daily rate per terahash of 0.00000044865 BTC, multiplied by hashrate and divided into the 0.01 BTC target. The last column shows how much the same hardware produces over a quarter, which is often a more useful planning horizon than the target itself.
| Hashrate | Daily output | Days to 0.01 BTC | Output in 90 days |
|---|---|---|---|
| 100 TH/s | 0.00004487 BTC | 222.9 | 0.0040383 BTC |
| 250 TH/s | 0.00011215 BTC | 89.2 | 0.0100935 BTC |
| 500 TH/s | 0.00022433 BTC | 44.6 | 0.0201897 BTC |
| 1 PH/s | 0.00044865 BTC | 22.3 | 0.0403785 BTC |
Note the 250 TH/s row: it crosses the target inside a single quarter, at 0.0100935 BTC in 90 days. That is the practical argument for a mid-sized rig over a small one — not a better rate, since the rate is identical, but a target that arrives within a planning cycle instead of beyond it.
Worked example
Follow 100 TH/s from share to schedule, then scale.
- Network share: 100 ÷ 1,003,000,000 = 0.0000000997, or 0.00000997%.
- Daily coins: 0.0000000997 × 450 = 0.00004487 BTC.
- Days to target: 0.01 ÷ 0.00004487 = 222.9 days.
- At 250 TH/s, 2.5 times the hashrate: 0.00004487 × 2.5 = 0.00011215 BTC a day, and 0.01 ÷ 0.00011215 = 89.2 days.
- At 500 TH/s, five times: 0.00022433 BTC a day, and 0.01 ÷ 0.00022433 = 44.6 days.
- At 1 PH/s, ten times: 0.00044865 BTC a day, and 0.01 ÷ 0.00044865 = 22.3 days.
- Value check: 0.01 BTC × $84,692 = $846.92 gross, or $812.06 after the listed 4% on the block-reward component.
Turning the timeline into a decision
A timeline only becomes useful when it is set against a cost schedule. Write the days to target beside the machine's purchase price and its monthly power draw, then ask whether the coin value at the end covers both. For the 100 TH/s case the answer is delicate: $846.92 of gross output against seven months of electricity leaves very little room for hardware cost unless power is unusually cheap. At 1 PH/s the same seven months produces several multiples of the target, and the fixed costs spread across far more coins, which is the entire argument for density.
This is also where payout method shows up in a plan. Under PPS+ the coins arrive hourly and can be converted or pledged as they land, which lets a miner offset power costs month by month instead of waiting for a target. Under PPLNS the arrival is lumpier, and a plan that depends on hitting 0.01 BTC by a particular week inherits that lumpiness. Neither approach alters the expected total; they alter how usable the balance is along the way. A miner paying a power bill on the fifth of each month will notice the difference long before the target date arrives.
Frequently asked questions
Can I hit 0.01 BTC faster by switching pools?
Not by much. Expected daily output depends on your share of the whole network, so the pool changes the cadence and variance of payouts rather than the long-run total.
How much does difficulty change the 222.9-day figure?
Each 1% rise in difficulty adds roughly 1% to the timeline; with the next estimate at −2.12%, the 100 TH/s figure would shorten to about 218 days if that estimate holds.
Does pool luck affect my days-to-target estimate?
Under PPLNS it does in the short run, because payouts follow blocks actually found; under PPS+ the estimate is unaffected and only difficulty and your own hashrate move it.
Write the schedule, then revisit it
Pick your hashrate, divide the target by the daily rate, and date the result. Then run the same numbers through the Profit Calculator with current price and difficulty to see the same output expressed in dollars. Two figures, one line, updated when the difficulty estimate moves — that is a plan that survives contact with a changing network, and it takes less time than reading another review.
Sources: the pool state page for Pool Hashrate and Pool Luck readings[1], and chain data read 21 Sept 2026 — network hashrate 1,003 EH/s, difficulty 132.76 T, subsidy 3.125 BTC per block, 144 blocks per day, BTC $84,692 — published 22 Oct 2026. Day counts and dollar values are arithmetic on those inputs.